Understanding our charts
Spending levels
When a chart such as Figure 1 appears in a document, what does it mean? To help we’ll also use the information from Figure 2.
The question we’re helping to answer here is: If I want to spend a certain amount of money each year in retirement, what’s the likelihood it will last for 25 years?
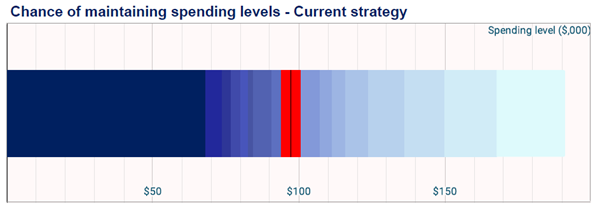
In all our charts we use different shades of blue to show how likely something is – the darker the colour, the more likely something is. In this case, if we want to spend low values every year, such as $50,000, then there is a high likelihood (darkest blue) that we’ll be able to keep this up for 25 years. On the other hand, if we want to spend something like $150,000 a year (light blue) then the fund will likely run out.
There are 20 bands of colour in the chart, each representing a change in the chance of the spending level lasting, drops by 5% (going from left to right).
The first line of Figure 2 tells us that the darkest blue band on the left ends at $68,287 per annum. There is a particularly good chance (95%, or 19 times in 20) that if a person spends $68,287 each year then the fund will last for 25 years or more.
If we look at the chances that higher levels of spending will last, then we can see the associated colour getting lighter and lighter in tone – the chances are dropping. A spending level of $80,052 has 3 chances in 4 of lasting, that’s 15 in 20, or 75%.
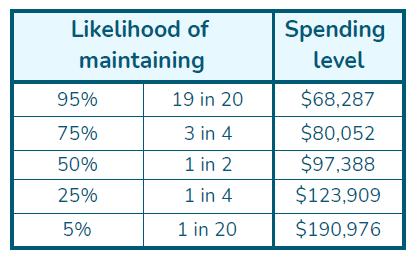
The black line in the middle of the chart shows the level of spending ($97,388) that has a 50:50 chance of lasting 25 years. We highlight, in red, the two 5% bands on either side of this middle value to give an idea of where typical values of sustainable spending could be. The technical term for the middle value is the median.
If we want to spend $190,976 a year, then there is only 1 chance in 20 that it will last for the 25 years. That would definitely be nice, but it’s definitely unlikely.
How to use this chart
Before retirement
If there are many years left to retirement, then the range of possible sustainable spending levels will be wide – there’s so much uncertainty out there, in the markets and economy, that it’s impossible to make a precise estimate.
As retirement comes closer, the range of possibilities starts to narrow. The two main things that people tend to focus on are, firstly, the median value with its 50:50 chance of running out, and, secondly, the spending levels that have a high chance. A tradeoff often occurs between these two ideas – if you want a higher median spending level, then what typically happens is that the chance of having a poor spending level increases.
This becomes clearer when we start to compare different investment strategies in other charts
After retirement
When a person is in retirement there is less of an effect for the investment returns. This comes about for two reasons:
Ø In future years there are less assets in the fund because of the drawdowns.
Ø The Age Pension acts as a buffer on the downside. If assets fall in value, then the amount of partial pension increases.
If the chance of a low spending level appears too high, then a change to a more defensive investment option could be considered.
The age at which the Super Fund has a 50:50 chance of running out (92 is our default age) can also be varied to see the effect on likely spending levels.
Extras
There’s a few extra things we need to remind you of:
Ø All values are in todays dollars. So, when you see a future value of $1,000, it should buy the same amount of goods as $1,000 would today.
Ø We’re assuming that all today’s super rules and tax laws stay the same for the full projection. Given how quickly the government changes these rules, that’s not realistic, which is why we offer the 12 month subscription model at a price that everyone can afford. This allows the subscriber to rerun the analysis whenever they wish.
Ø When the superannuation fund has no assets left, the spending level reverts to the Age Pension level. If the Age Pension asset or income tests allow it, then a partial pension is included in the calculated spending levels.
Ø Part of the spending levels require capital drawdowns from the fund. This is in line with the original intention of the Superannuation Legislation, only intending the superannuation system to supplement the Age Pension in retirement.
Dr Frank Ashe
21 March 2021