Confidently Project and Manage your Financial Future
The future is uncertain.
But your retirement finances shouldn’t be.
Superannuation forecasts and retirement estimates are the buzz words.
We put those words into action!
We’re here to help people get a better understanding of the possible levels of spending they can maintain in retirement, how much they may have at retirement, and the uncertainty around these numbers.
All at a reasonable price.
It’s your super! Take control now!
Get started here
Our Retirement Income Report is the best place to start. It shows the significant effects that changes in your investment strategy (also called asset allocation or investment option), and other choices such as additional contributions or purchasing an annuity, can have on your retirement income.

Or see all our reports here:
Access to all our fully customised reports is available via subscription.
The Retirement Income Report shows the effect of different investment options on the retirement income. It also allows what-if analysis of possible future actions to be done, such as taking a break in super contributions, investment in non-superannuation assets, or purchasing an annuity. This is important for the SMSF Trustees producing their required Investment Strategy.
The Investment Strategy page helps SMSF Trustees to produce a document that can serve as a basis for the Investment Strategy that is an Australian Taxation Office requirement for all SMSFs.
The Retirement Income Strategy page helps SMSF Trustees to go through the steps to produce an income strategy. Even though this is not necessary for SMSFs, it is recommended to do this; it serves as a good complement to the Investment Strategy process for those people in or nearing retirement.
The Early Super Withdrawal Report concerns the person who is considering accessing their super early; we provide an analysis that shows the real cost of early withdrawal of super, and ways in which the expected retirement income may be improved.
A subscription gives full, unlimited access to all our reports for 12 months.
Read about the reports and access them here:
Why Should Australians Care?
Saving for retirement is an important part of life in Australia. The Age Pension provides a quite modest, but adequate, level of income for most people. The superannuation savings system has been designed to give people a higher standard of living, comparable to what they had before retirement.
But the system is complex, and the time frame over which we need to think about retirement is long – when you retire your expected lifespan is more than 20 years. There is a lot of uncertainty in thinking about what could happen.
mProjections, with our superannuation calculator, is here to help people to get a better understanding of what can occur in the future, showing both the good and the bad, and helping people to make better decisions on what to do now.
Our superannuation projections assess the impact of decisions by taking into account the factors that our regulatory authorities require, e.g. inflation, reporting in today’s dollars, and show annual (and fortnightly) payments in retirement for 25 years.
We provide a comprehensive outline of our forecasts, informed super projections, and modelling.
Act now by investing $85.00 (including GST) to buy a 12 month subscription that gives Members access to all our current Superannuation Reports, as often as they need, and on-going updates such as:
- More asset classes and asset allocation for super discussion
- Retirement report that shows the different retirement benefits of changing Investment Options
- Goal-directed investments with education as one of the goals.
Features of our Super Reports
Project the fund size
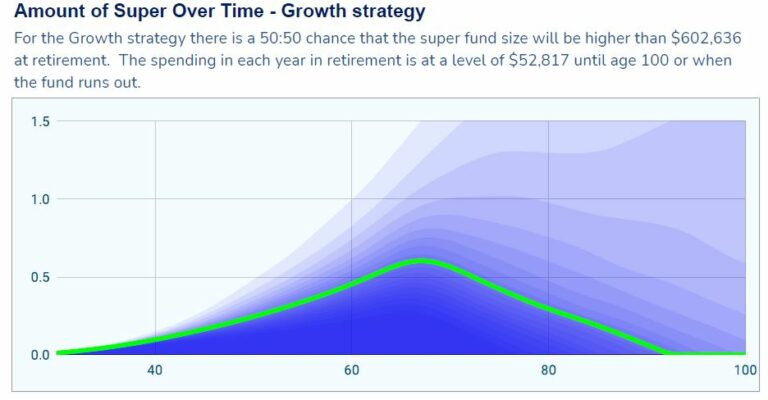
What could be the fund size before and after retirement, in current value (today’s dollars)?
This chart shows the fund size, in millions of dollars, from the present time till age 100. In the chart, the darker colours mean a better chance that the fund will be at least that size. The green line is the middle value – there’s an even chance that the actual fund may be above or below that amount.
Forecast superannuation income
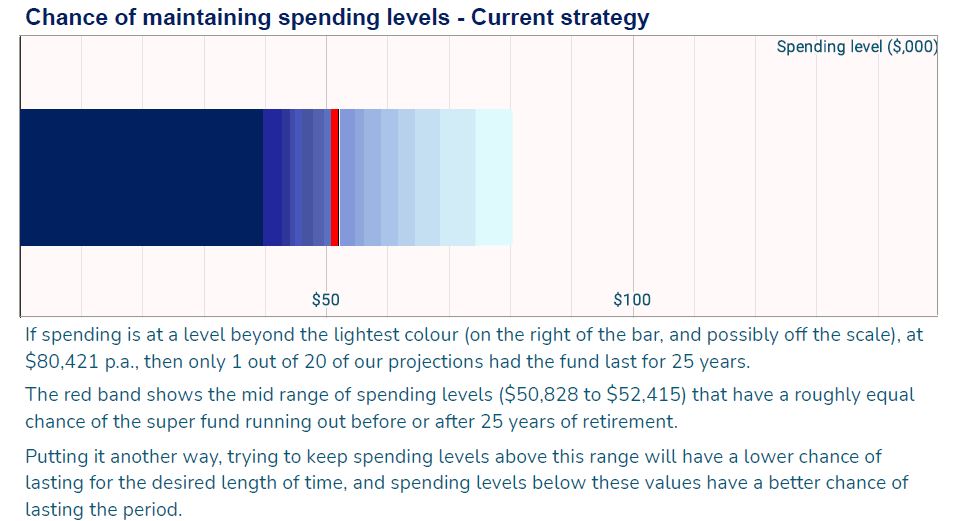
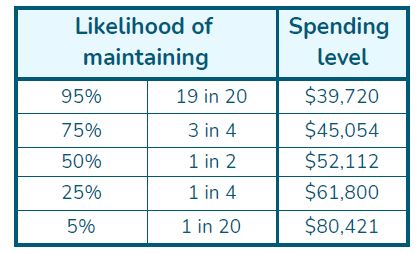
Assess the annual income that may be available from a super fund after retirement for 25 years (or whatever period you’d like). Income includes dividends, sale of assets and part or full Commonwealth pension.
In the bar chart, the darker colours mean a better chance that the income from the super fund (including any full or part pension) that can be spent for 25 years, will be at least that amount. The red line is the middle value – there’s an even chance that the actual income that could be maintained is above or below that amount.
Project for one or two people
Our Report allows for 1 or 2 people, with any age difference, helping investors to be more informed about their super future (including Members of an SMSF) and to make better, more informed decisions on their most important savings.
We also project either person purchasing an annuity in retirement.
Pension payments depend on whether a person is single or part of a couple.

Retirement cash flow from different investment options
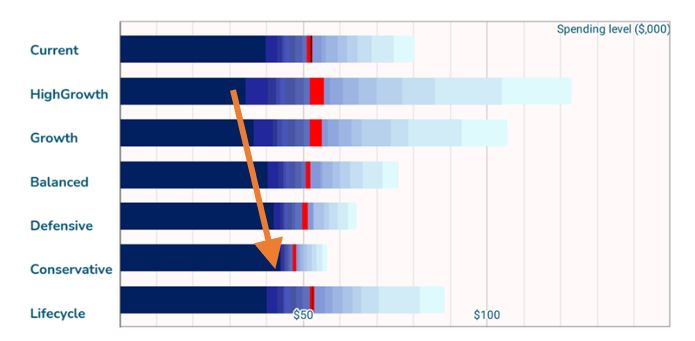
Compare forecasts of typical outcomes, as well as potential very good and very bad outcomes.
Each bar shows possible incomes (in 000s) for the current asset allocation, and a range of typical investment options available in the market.
We also include a Lifecycle option, that starts with high allocation to Growth assets and gradually decreases this.
In the bar chart, dark colours indicate incomes that will likely be able to exceeded, and light colours indicate only small chances of being obtained.
Effect of possible actions
What would happen if … ?
Life is full of choices. Their effects on future retirement income can be seen for such possibilities as:
◊ taking time out from employment for 10 years for family commitments;
◊ deciding to get extra income in retirement by working part-time;
◊ investing in an annuity for retirement;
◊ having investments outside of superannuation;
◊ downsizing the home.
We allow users to see the effect of more than 10 important life decisions.
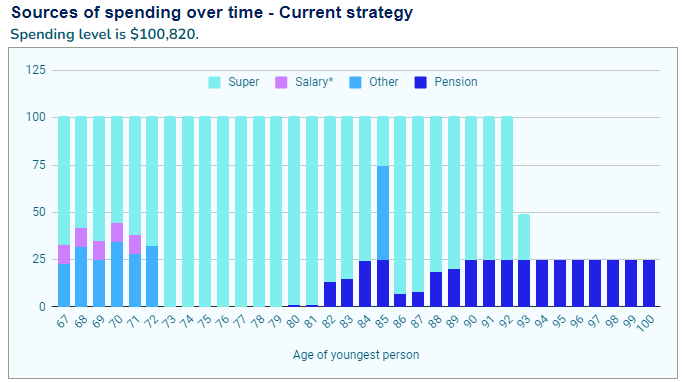
The example chart shows additional income from part-time work (mauve), non-superannuation assets (blue), and the effect of downsizing at age 85. Withdrawals from super are in light blue.
Act now by investing $85.00 (including GST) to buy a 12 month subscription that gives Members access to all our current Superannuation Reports, as often as they need, and with on-going updates and new reports.
Improve your retirement, now!
Photos by Rachel Claire from Pexels