Investment Strategy
The Australian Tax Office requires that each Self-Managed Superannuation Fund (SMSF) has a documented Investment Strategy that describes:
- the types of assets the Fund will hold;
- typical proportions of the Fund for these assets;
- liquidity and diversification;
- insurance.
In this section we can assist SMSF subscribers to write an Investment Strategy. This is emailed to the subscriber for any later editing that may be required.
If you haven’t already seen one of our Retirement Options Reports, you can read about them here or go straight to the questionnaire to produce one.
If you want to go straight to producing the Investment Strategy Document then click here.
If you’re not a subscriber then become one here:
Using this document
If you know what the broad details of your Investment Strategy are, then you can skip this and go straight to producing an Investment Strategy Document.
To understand why you need an Investment Strategy we give the background here.
The main component of an Investment Strategy Document is the asset allocation, which has to be chosen by the Trustees – see here.
Our Investment Options Report will help in the choice, so we describe how that works here.
Then some decisions need to be made, that we talk about here …
… and (if you’re a subscriber) we’re ready to produce the strategy now!
Background
Superannuation regulations (see here) require SMSF trustees to:
- Have an Investment Strategy;
- Consider insurance for members as part of the fund’s Investment Strategy;
- Consider fund liquidity i.e. how will assets be accessed when payments need to be made to members;
- Consider the diversification of assets i.e. whether you have all your assets in one basket, or too few baskets;
- Regularly review their Investment Strategy.
This Investment Strategy document you create here will assist in meeting these requirements. Trustees will need to customise this to their specific requirements and circumstances. There is no prescribed layout for the Investment Strategy so please insert or delete words as appropriate for your fund’s specific circumstances. (See our tutorial here on how to do this.)
The legislation does not prescribe what time period constitutes “regularly” reviewing an Investment Strategy. Anything less than an annual review may not be regarded as regular – so consider if this document is to be reviewed, updated if necessary, signed and filed on an annual basis. An mProjections subscription makes this review process easy and cost effective, alongside the regular monitoring of the fund’s performance.
Insurance is not compulsory for members but Trustees need to be able to demonstrate their consideration of the requirement for insurance. The legislation does not say how this is done; a comment in either the Investment Strategy or the fund’s annual minutes is possible.
Choosing an Investment Strategy
An Investment Strategy is distinguishable from another by its asset allocation which lists the asset classes allowable under the Strategy and the percentage of the Fund that can be held in each asset class, expressed as a range.
The most important aspect of any Strategy is the allocation between “growth” asset classes and “defensive” asset classes. “Growth” asset classes include shares (both Australian and overseas), property and possibly collectibles – types of investments where a significant element of the expected return comes from capital gains. “Defensive” asset classes include cash and bonds – investments where the expected return comes from regular interest payments, other fixed rate earnings, and repayment of the capital.
For simplicity, we will just refer to the two types of asset classes – growth and defensive – in describing Investment Strategies.
Our Retirement Options Report may be helpful in choosing an appropriate investment strategy for an SMSF. The Report has charts that show likelihoods of maintaining the different spending levels that could arise when a Member enters retirement. It also shows Fund values as time goes by, and comparatives of different Investment Strategies.
If you’re a subscriber and would like to go straight to our questionnaire to prepare a personalised Investment Strategy document then click here.
Otherwise, the next section walks you through a sample of the Investments Options Report to help you decide on an appropriate Investment Strategy.
What’s in the Retirement Options report
The first chart showing forecast spending levels with different likelihoods. The asset allocation is very important as we see in the next series of charts where we change the asset allocation to be:
- The current asset allocation
- asset allocations with 85% to 25% in Growth assets (equities and similar assets), and
- a Lifecycle asset allocation that starts at 100% in Growth assets, declining to 40% as the person gradually ages.
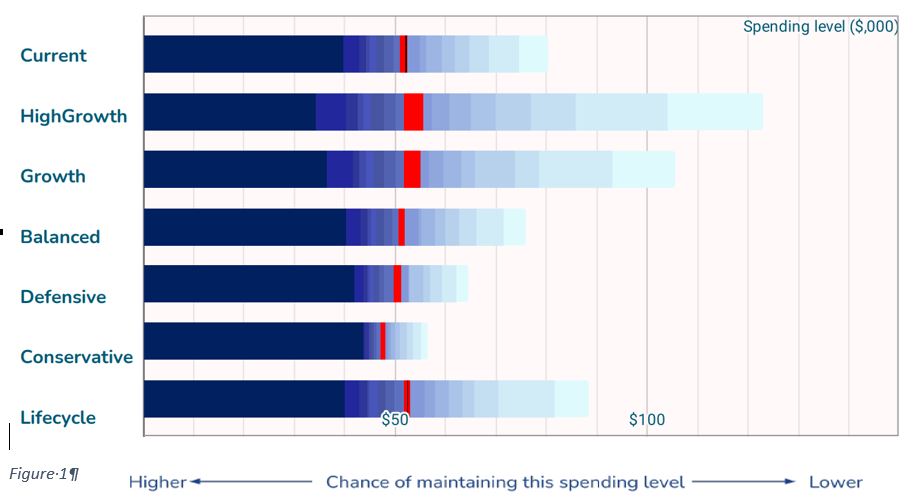
How the asset allocations affect the likely retirement spending levels after retirement is shown in the following chart.
This chart shows the range of possible annual spending levels (ie, annual ‘income’; ‘retirement spending’) and the probability of the retirement spending running out before the first 25 years of retirement. When these forecasts are considered, it is important to look at the range of possible outcomes as well as the forecast outcome. This is because investment markets can go down at the most inconvenient time.
As retirement spending levels increase in this chart, the chance that the Fund will run out earlier than 25 years increases. A lower forecast spending has a lower chance of running out. The red line shows a 50:50 chance.
Spending level is determined by the total of dividends, interest, capital drawdowns, annuity payments, and age pension and is calculated to comply with current tax and age pension legislation and in today’s dollars.
In viewing the charts, it should be noted how the forecasts show a lower median spending level and a narrowing of the range of outcomes as the asset allocation becomes more committed to ‘defensive’ assets. As a Fund adds to its proportion of ‘defensive’ assets (cash, fixed interest) the spending level will need to be decreased to reduce the chance of it running out earlier than desired. On the other hand, the possibility of having to reduce it to a very low level is also reduced.
As the allocation to growth assets increases, not only does the forecast cashflow in retirement increase (generally speaking), but so does the range of possible outcomes. Whilst it is tempting simply to choose the Strategy with the highest possible cashflow, this needs to be assessed carefully.
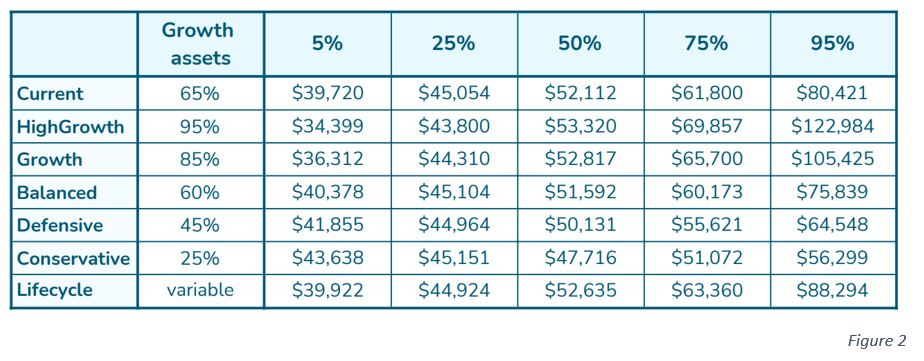
The table on the left shows this trade-off for all the asset allocations. The 5% column shows the annual spending level that only has a 5% chance of not being able to be sustained. That is, we have high confidence that this spending level will last to age 92. Funds with low growth asset allocations have the higher values. The 75% column shows the spending amount that could be possible with 1 chance in 4 (25%). Funds with high growth assets give the best chance of high spending levels.
The trade-off is seen, with High Growth and Growth funds with better possible spending levels (about $15,000 p.a. better than the Conservative) but the chance that things could go bad with only being able to spend about $9,000 p.a. less than in the Conservative case.
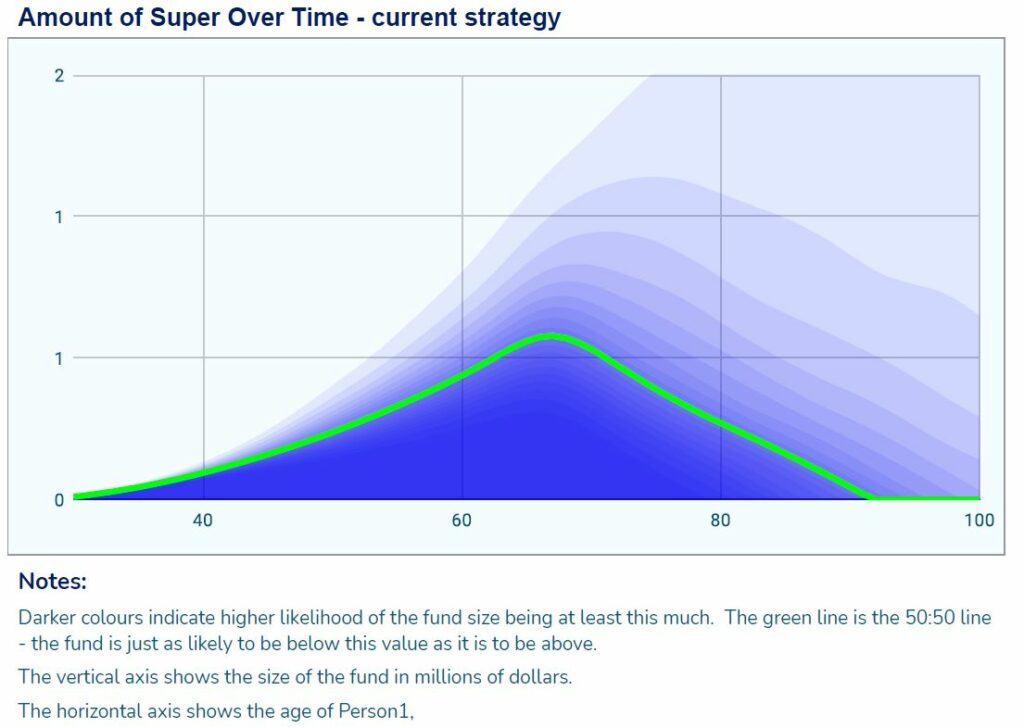
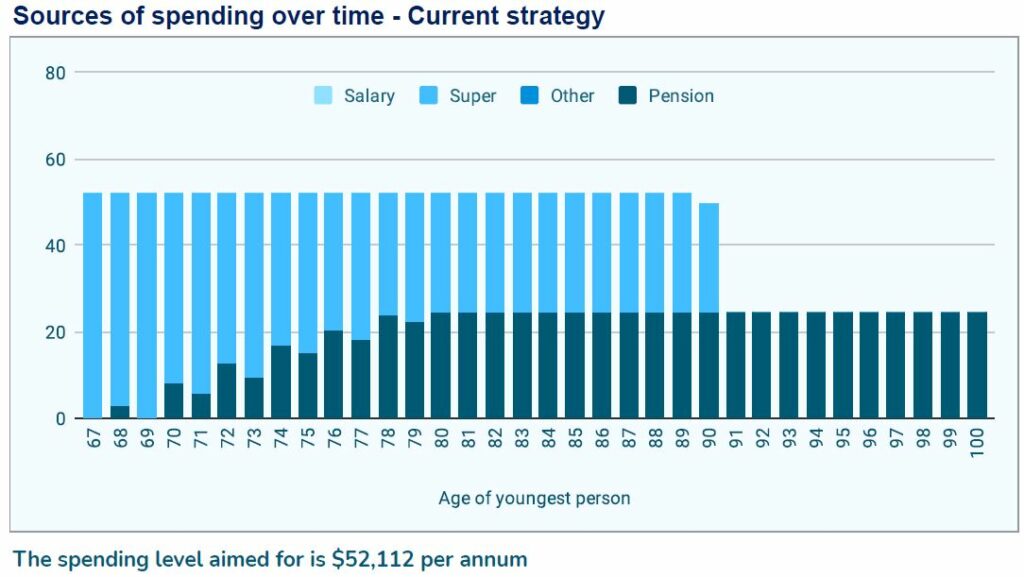
If you’re curious about where the money comes from, page 6 gives an indication of the sources for a typical amount of income for a typical level of asset returns over time. The example shows payments being made from the superannuation fund in the early years of retirement, and with pension payments increasing as the assets decline to a level below the pension assets test.
In this example, after 25 years the super fund has been exhausted and all income in the person’s late 90s is gained from the pension. If an annuity has been purchased then the annuity payments would continue till age 100.
These charts are also shown for two other asset allocations.
Deciding what to do
The mProjections system shows a forecast of retirement spending levels for various Investment Strategies. It takes into account certain SMSF data and possible economic scenarios. It also shows the range of possible outcomes with the unknowns of future investment returns.
When these forecasts are considered, it is important to look at the range of possible outcomes as well as the forecast outcome. This is because investment markets can go down at the most inconvenient time.
As the allocation to growth assets increases, not only does the forecast cashflow in retirement increase (generally speaking), but so does the range of possible outcomes. Whilst it is tempting simply to choose the Strategy with the highest possible cashflow, this needs to be assessed carefully.


Diversification
Diversification is the term describing how the assets of an SMSF are invested across different asset classes. Suitable diversification is an efficient way to reduce the range of possible spending levels in retirement, giving members a higher confidence in their outcomes.
Low diversification occurs when the assets are only invested in a few assets. An example is when an SMSF may be invested only in one or two residential properties. Or the share market portfolio may only consist of a small number of bank stocks. These are called concentrated portfolios. There are two dangers with a concentrated portfolio. One is the possibility that the small number, but large proportion, of these assets may lose significant value. The second, and more likely, is that over the long term the return for these assets is not as high as expected.
High diversification occurs when the investments are spread over a wide range of assets. Not all assets move up or down by the same amount and at the same time. A spread of assets usually allows a portfolio to offset some large losses in some assets by smaller losses, or even gains, in other assets.
There are other ways of increasing possible spending levels, which do not form part of the Investment Strategy: the contributions to the Fund could be increased, and/or retiring one or more years later. Our Retirement Options Report gives you the ability to test over 10 different choices that could be made that can change your spending levels in retirement.
Increase your contributions?
If you increase your contributions to your super fund, by say $1,000, the Fund will allow additional spending each year in retirement.
Delay retirement?
By delaying retirement, by say 1 year, retirement cash-flow would increase.
This is because retiring later allows an SMSF to accumulate more assets over the additional period of working and contributing to the Fund.
When considering the choices listed on the previous pages, increasing contributions and/or delaying retirement are fairly straightforward. The option, of changing the investment strategy, is harder because it involves other considerations.
SMSFs need to take into account circumstances such as the desired standard of living both before and during retirement in deciding what to do.
Our Retirement Income Strategy page is designed to help an SMSF Trustee to go through steps that will give a an idea of what retirement income could look like in different scenarios.
What do the terms mean?
Growth assets: These assets have returns that are linked to the growth rate of the general economy. The most common examples are company shares listed on the world’s stock exchanges, and property – residential, shopping malls, offices, industrial parks etc. The rate of return on these investments is uncertain, though this is compensated by having the expected return being higher than for other assets.
Defensive assets: These assets have returns that are much more certain. Examples are bank deposits, term deposits, government debt, and corporate debentures. The high degree of certainty attached to these assets comes with a lower expected rate of return than growth assets.
Investment Strategy: The split between growth and defensive assets in a fund is called the investment strategy. There are a variety of names used for this idea by the wealth management industry. Large superannuation fund managers give their members a choice of investment options, which have different investment strategies. In an SMSF it is a requirement of the Australian Tax Office that an investment strategy be officially adopted by the Trustees.
The investment strategy can change through the life of the fund. An mProjections subscription allows a fund’s strategy to be assessed regularly, giving investors more confidence in their retirement futures.
Lifecycle investing: One investment strategy that regularly changes the split between growth and defensive assets is a lifecycle strategy. This also goes by the name of a glide path. One example of such a strategy is to have the fund invested 100% in growth assets when a person is aged 30 or less, giving a high expected rate of return. Every 5 years the proportion of growth assets is reduced by 10%. When the investor reaches age 70 the fund has only 20% in growth assets, and 80% in defensive assets, giving a much more certain level of income.
Photo by Ryutaro Tsukata from Pexels, Alex Green from Pexels