Understanding our charts
Multiple Asset Allocations & Spending Levels
When a chart such as Figure 1, with multiple blue bars, appears in a document, what does it mean? To help we’ll also use the information from Figure 2. Our document Understanding our Charts – Spending levels explains how to understand each individual horizontal bar.
The question we’re helping to answer here is: If I want to spend a certain amount of money each year in retirement, what’s the likelihood it will last for 25 years, and how does this change as I change my asset allocation?
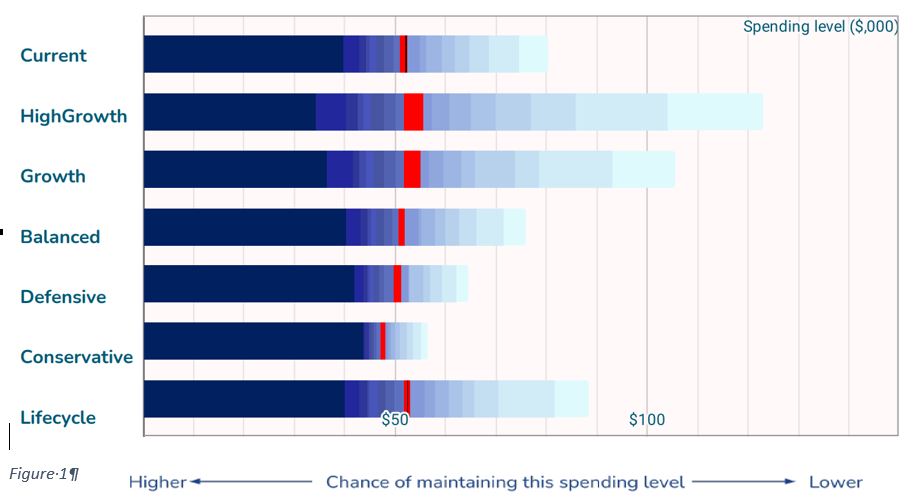
This example is based on a 30-year-old person with a small current amount in Super and an average income.
Assets
First, let’s talk about what the term asset allocation means. Simply, it is how the assets (investments) of the superannuation fund are allocated to different classes of investments. There are numerous ways in which people refer to this idea: investment option; investment strategy; portfolio structure … When projecting for long periods of time, as we are when looking at superannuation outcomes, the most important decision is the allocation of investments between what we call growth assets and defensive assets[1].
Growth assets are those that, in the long-term, grow in value at a rate that’s linked to the growth rate of the economy over the long-term. Examples include corporate shares, both listed and unlisted, and property. They also generally pay out income to the investor in the assets, such as dividends for shares, and net rent for property. The value of these assets is often volatile in the short-term – in any single year your return may be very bad or very good, though quite often it will be moderate.
Defensive assets have very little short-term volatility, which explains their name – they defend the value of the money that’s invested in them. However, that defensive nature reduces their potential rate of return over the long-term.
The Asset Allocations
We look at a variety of asset allocations to show the effect of the allocation on the likelihood that a particular spending level will not be able to be maintained in retirement. Figure 2 summarises the results for likelihoods from 5% (you can be confident that the level of spending can be maintained), to 50% (the spending level will be equally likely to run out as be maintained), to 95% (it’s highly likely to run out, less than 5% chance of lasting 25 years).
The first row of numbers shows results for the asset allocation given by the user. In this case the asset allocation is 65% in growth assets. The other 35% are in defensive assets for this analysis. It is assumed that this allocation is kept constant through to age 100[2].
The first figure in this row – $39,720 – is the level of spending that is projected to only have a 5% chance of running out within 25 years (or whatever length of time in retirement you choose).
_________________________________________________________
[1] More discussion of different forms of assets are available in another document on our site.
[2] This assumption is made for simplicity. We recommend that the allocation be reviewed regularly to ensure its continued suitability.
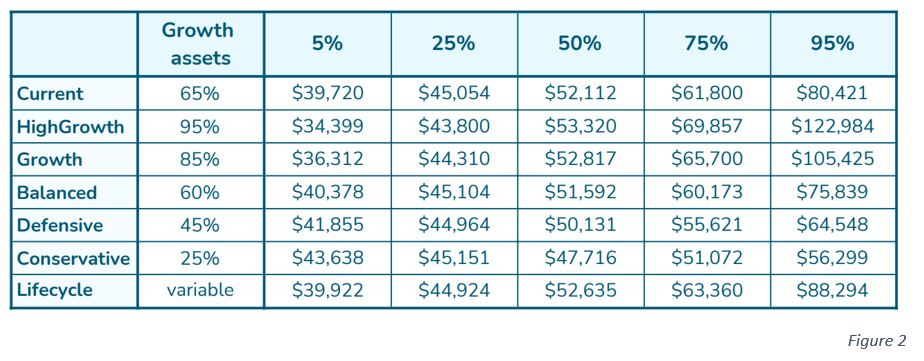
The value in the 50% column – $52,112 – is the level of spending in retirement that is estimated to have 1 chance in 2 to last 25 years.
On the other hand, if you aim to have a spending level of $80,421 in retirement, then there’s only a 5% chance that it will last for 25 years.
The next 5 rows in Figure 2 show the spending levels and likelihoods for 5 asset allocations that are commonly available via superannuation fund providers. The asset allocations range from 95% in growth assets to 25%.
Notice how the spending levels that have a low chance of running out increase – $34,399 to $43,638 – as the allocation to growth assets decreases (defensive assets increase). A person who was very worried about the worst that could happen may decide that a low amount of growth assets may be suitable for them.
But there is a counterpoint to this reasoning. As the amount of growth assets decreases the more typical payoffs, at the 50% likelihood, decrease from $53,320 to $47,716. Locking in a safe amount in the worst case also locks out the better outcomes available in the more typical possible future outcomes.
It’s even more dramatic for the potential outcomes on the upside. Let’s look at the 75% column where there is 1 chance in 4 that the spending level could be maintained for 25 years. With the High Growth asset allocation $69,857 could be maintainable, dropping to $60,173 for the Balanced strategy, and down to $51,072 for the Conservative strategy.
The differences between the allocations are even more extreme at the 95% level (unlikely, but possible), going from $122,984 to $56,299.
So there is a tradeoff. An investor can obtain a high degree of certainty that some minimum level of spending can be maintained, but this may severely reduce the chances of getting a much better outcome.
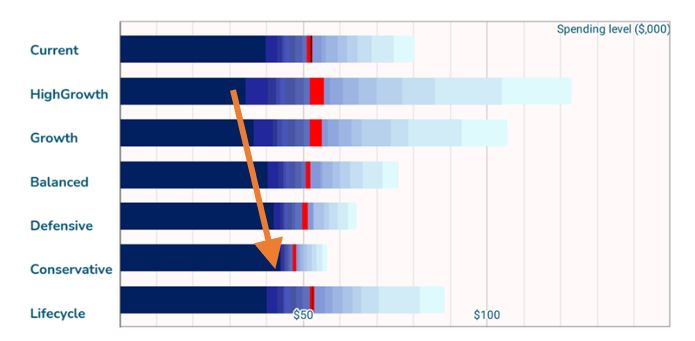
The Lifecycle allocation
The last asset strategy – the Lifecycle – is different to the previous strategies in that it doesn’t have a constant asset allocation throughout life. When investors are young, the assets are allocated to growth assets. As they get older the asset allocation to defensive assets becomes gradually larger. In this example the growth allocation is at 100% (equivalent to High Growth) till age 35, and then drops 5% every 5 years till age 80 when it reaches 45% (equivalent to Defensive allocation) and stays at that level[1].
This strategy combines some of the features of the different static asset allocations. Comparing it to the Current allocation we see it has similar spending levels that we are quite confident that we can maintain – $39,720 vs $39,922 for the 5% likelihood, and $45,054 vs $44,924 for the 25% likelihood. For the potential incomes that we may be able to maintain, the Lifecycle strategy gives higher values – $61,800 vs $63,360 for the 75% likelihood, and $80,421 vs $88,294 for the 95% level.
One important point that the Lifecycle strategy shows is the potential benefit of a dynamic asset allocation strategy. A High Growth strategy does not need to be maintained forever, it may make sense to reduce a current high exposure to growth assets at some time in the future.
[1] Other ways of doing this are possible, these values are indicative of the benefits that may be possible with this strategy.
How to use this chart
If there are many years left to retirement, as in the example in this document, then the range of possible sustainable spending levels will be wide – there’s so much uncertainty out there, in the markets and economy, that it’s impossible to make a precise estimate.
This range of possible outcomes is because of two effects. Firstly, for any asset allocation the possible investment market behaviours over the next 50+ years is huge. Secondly, the potential difference between the asset allocations’ expected returns has a long time to manifest itself.
The two main things that people tend to focus on are, firstly, the potential good outcomes that may occur: such as the median value, with its 50:50 chance of running out, or possibly the 75% level (1 chance in 4 of being maintained); and, secondly, the very secure spending levels that only have a low chance of running out, such as the 5% level (equivalently, a 95% chance of being maintained). A tradeoff often occurs between these two ideas – if you want a higher median spending level, then what typically happens is that the chance of having a poor spending level increases.
This tradeoff is shown in Figure 3. As we move from left to right across the chart the values show the spending levels that only have a small chance (5%) of running out – for example, the position of the High Growth circles indicate that if the investor wants only a low chance of running out, then they should aim for spending a bit over $34,000 a year. For a Conservative strategy they could aim for spending almost $44,000 a year and be very confident (95%) that it will last for 25 years.
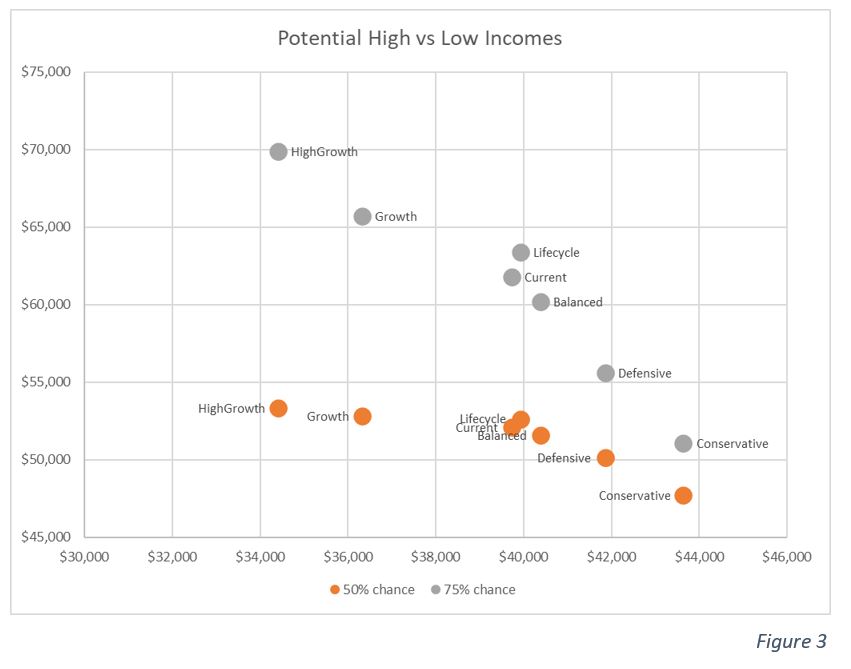
The vertical axis shows spending levels that have a 50% chance of lasting for 25 years (orange circles), and 25% of lasting for 25 years (75% chance of running out) (grey circles). Asset allocations that have the highest sustainable spending levels – Defensive and Conservative – have the lowest potential for a high sustainable spending level.
If a High Growth strategy is adopted and then to be very confident that a spending level would last for 25 years, then they’d have to set that spending at about $34,000 per year. But, a spending level of $53,000 could be maintained 50% of the time, and it’s possible that, 1 time in 4, a level around $70,000 could be maintained for 25 years.
Examining charts such as these allows investors to decide how to tradeoff the possible higher values with the possibility of the lower values when deciding on an asset allocation strategy. Plus, the benefit of our subscription package is that this analysis can be run at any time. Should future conditions be more favourable, or unfavourable, than anticipated, then a new analysis may indicate that a different asset allocation is preferred. This can then be executed through the investors preferred channel.
Extras
There’s a few extra things we need to remind you of:
- All values are in today’s dollars. So, when you see a future value of $1,000, it should buy the same amount of goods as $1,000 would today.
- We’re assuming that all today’s super rules and tax laws stay the same for the full projection. Given how quickly the government changes these rules, that’s not realistic, which is why we offer the 12 month subscription model at a price that everyone can afford. This allows the subscriber to rerun the analysis whenever they wish.
- When the superannuation fund has no assets left, the spending level reverts to the Age Pension level. If the Age Pension asset or income tests allow it, then a partial pension is included in the calculated spending levels.
Part of the spending levels require capital drawdowns from the fund. This is in line with the original intention of the Superannuation Legislation, only intending the superannuation system to supplement the Age Pension in retirement.